I never thought I was smart enough for data design.
I was getting an art degree; I had chosen studio hours over studying, lineart over lectures. I loved geometry in high school but hadn’t taken a single math class in college. I had considered minoring in something science-related, but the arts advisers cautioned that the program was too intense for a non-art minor.
So I resolved the odd little passion I had for numbers to a fun fact, something to mention in passing: “I used to really love drawing graphs in physics class, isn’t that funny?”
Then, in my junior year, I took a design history class. It was taught by Dr. Dori Griffin, who I had wanted to have a class with since I was a freshman. Like any good history class, it changed my life. I had entered college with the idea of graphic design as a relatively simple process at the end of which you created a poster or a sticker or maybe even an album cover. Dr. Dori’s class turned this idea inside out.
The moment I remember most from the class was the first time I saw W.E.B. Du Bois’ work for the 1900 World’s Fair in Paris. Through colorful, mesmerizing graphs, maps and charts, he set out to get audiences interested in the socioeconomic advancement of African Americans through presenting historical data in a modern way. At the time, I had taken my notes and moved on. But the idea of design beyond what I had known had been lodged like a rock in my shoe.
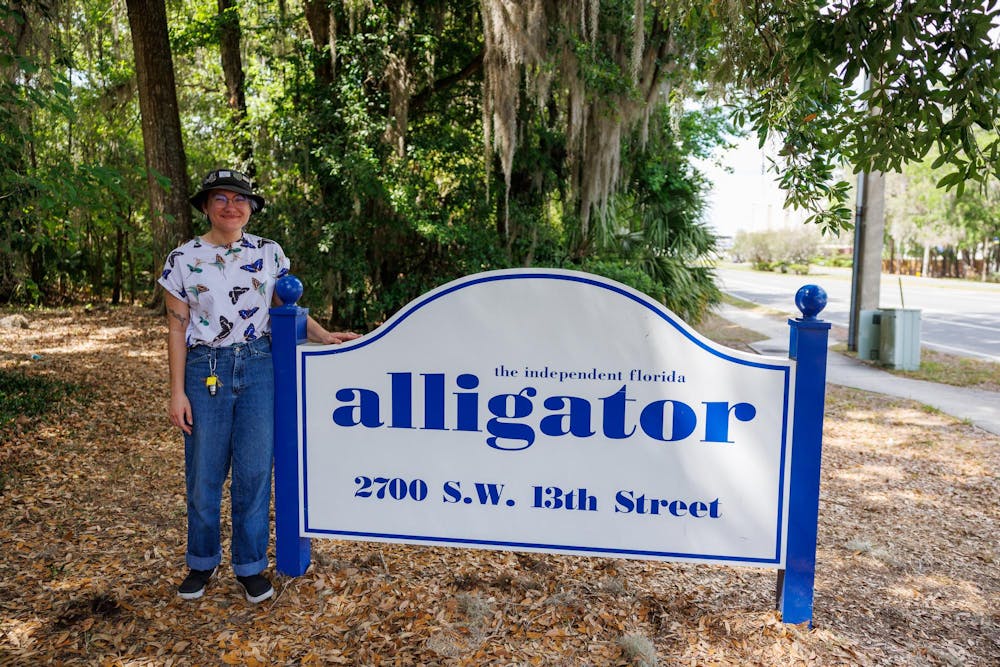
A month later, I found myself leaning backward over a couch at a party as someone beside me said something about an alligator. He was a photographer friend of my girlfriend’s. He said it again, that I should join The Alligator. They were hiring graphic designers for the Spring. They threw good parties. Sure, I said.
When I was filling out the application the next morning, I saw a little box under “graphic designer” that read, “data designer.” I remembered, then, Dr. Dori’s class and W.E.B. Du Bois’ spiraling population chart. I thought to myself, “No way I have the qualifications for this, anyway.”
I checked the box. Two weeks later I was hired.
So began a year and a half of surrounding myself with some of the smartest, most passionate people I have ever met. Every story I got to research or design for opened my eyes to a new perspective. I learned more than I ever thought possible about just how hard everyone here works to get their coverage. I got front-row seats to the escapades of our photographers. I even took a ride with one of our delivery drivers from midnight to four in the morning to locate some of our three hundred delivery locations.
After three semesters of this, I still don’t know if I’m smart enough to have been The Alligator’s data designer. But I’ve realized that’s not actually what matters. We didn’t end up at the Alligator because we were born with some great knowledge of politics or sports or Microsoft Excel. We found ourselves here for every late night and weekend meeting because of our care for our subjects and our passion for change.
We skipped classes to cover breaking news because we know deep in the center of ourselves that our work matters. I spent a year and a half here because I wanted to prove to our readers that a story’s data can reveal a deeper picture than they could ever imagine. Every graphic I made felt like a new connection I had to the world, and a new perspective on my place within it.
Thank you to Zoey Thomas, Sydney Johnson, Noah Lantor and Bayden Armstrong for your guidance.
My mother always told me to surround myself with smart people. Thank you all for showing me that I belong among you.
Del Halter was the Spring 2026 Data Designer.
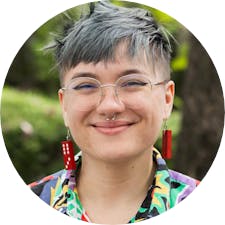
Del Halter is a Senior Graphic Design student in their third semester as The Alligator's Data Designer. They specialize in information design, especially its relation to environmentalism and advocacy. Outside of work, Del is an avid gardener and has made a few stop-motion short films.