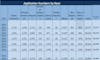
Population Percentage of Enrolled Undergraduates By Race
(03/18/15 12:30am)
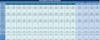
This chart lists the percentage of the total population each race comprises. The color-coordination indicates a 2010 change in how race is recorded from applications. At this time, two new categories were added (two or more races and Native Hawaiian or Pacific Islander). That is why no data exists for these two categories before 2010. The percentages were listed as zero to preserve the formulas used to calculate the percentages.