
Cyanne Dunn
·
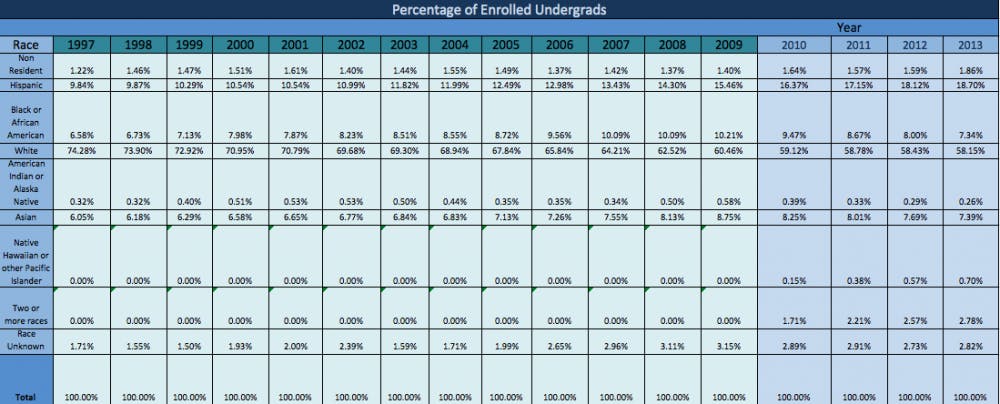
This chart lists the percentage of the total population each race comprises. The color-coordination indicates a 2010 change in how race is recorded from applications. At this time, two new categories were added (two or more races and Native Hawaiian or Pacific Islander). That is why no data exists for these two categories before 2010. The percentages were listed as zero to preserve the formulas used to calculate the percentages.
More

East Gainesville Meeting
By Olivia Lofaso | 1:54pmGainesville City Commissioner Desmon Duncan-Walker speaks at a community meeting in East Gainesville, Fla., Wednesday, July 22, 2026.

Spain World Cup Final
By Bayden Armstrong | 5:43pmA Spanish flag flies outside the Museo Reina Sofia, Friday, June 5, 2026, in Madrid, Spain.

Spain World Cup Final
By Bayden Armstrong | 5:43pmFans gather at Plaza de Colon, Monday, June 15, 2026, ahead of the Spain vs Cabo Verde World Cup Game, in Madrid, Spain.