
Cyanne Dunn
·
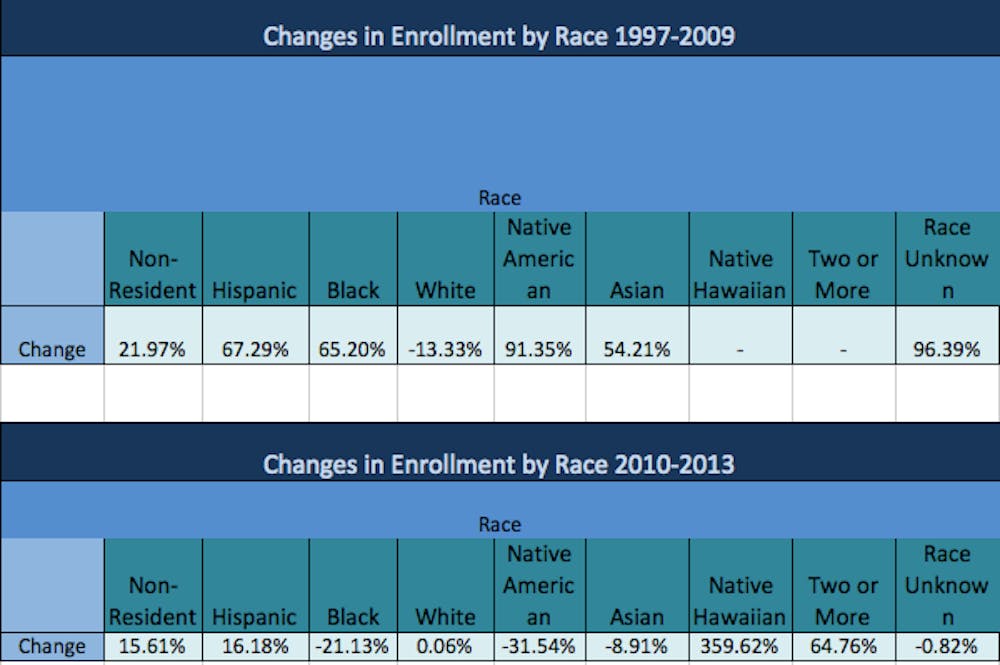
These two charts indicate the change in enrollment by race. They are split by year due to a 2010 change in how race is recorded from applications. At this time, two new categories were added (two or more races and Native Hawaiian or Pacific Islander). That is why no data exists for these two categories before 2010. When looking at the percentage change, it is important to keep in mind that smaller numbers will result in drastic changes in percentage. This can be seen especially in the 2010-2013 change for Native Hawaiian and Pacific Islander students, whose population numbers are very small.
More

Spain World Cup Final
By Bayden Armstrong | 5:43pmA Spanish flag flies outside the Museo Reina Sofia, Friday, June 5, 2026, in Madrid, Spain.

Spain World Cup Final
By Bayden Armstrong | 5:43pmFans gather at Plaza de Colon, Monday, June 15, 2026, ahead of the Spain vs Cabo Verde World Cup Game, in Madrid, Spain.

Spain World Cup Final
By Bayden Armstrong | 5:43pmSpanish flags fly on a building in Plaza de Zocodover, Saturday, June 20, 2026, in Toledo, Spain.